Observability
When running applications in production we need to send telemetry (metrics and tracing information) to some services like Prometheus and Jaeger.
Quarkus provides JVM and other statistics out-of-box with the Metrics extension, and it provides distributed tracing with the opentelemetry extensions.
Tracing
Let’s start with tracing. Tracing allows you to follow the flow of a request throughout your services. This becomes very important once you have more than one (micro) service running or are making external requests, eg. to a REST client or a database.
Add the OpenTelemetry extension
In a new terminal window at the root of your tutorial-app project, run:
./mvnw quarkus:add-extension -D"extensions=opentelemetry"quarkus extension add opentelemetryThe opentelementry extension works out of the box and will start sending data to a grpc receiver (by default localhost:4317) if we send new requests to the app.
Start an OpenTelemetry Collector
To start collecting and inspecting telemetry, let’s run a container that instantiates Jaeger (a tool to inspect telemetry data) and also acts as an OpenTelemetry collector and query service:
docker run --name=jaeger -d -p 16686:16686 -p 4317:4317 -e COLLECTOR_OTLP_ENABLED=true jaegertracing/all-in-one:latestCreate a few requests so we have some telemetry data to work with by hitting our /fruit endpoint a few times again:
curl localhost:8080/fruit?season=SummerTrace down the requests in Jaeger
Go to http://localhost:16686 in your browser. You should see the Jaeger UI, if not make sure the docker run command was executed successfully. To see the traces we just produced, select 'tutorial-app' from the Service dropdown and click 'Find Traces'. Depending on how many times you sent requests to the fruit endpoint, you’ll see a number of traces that were collected.
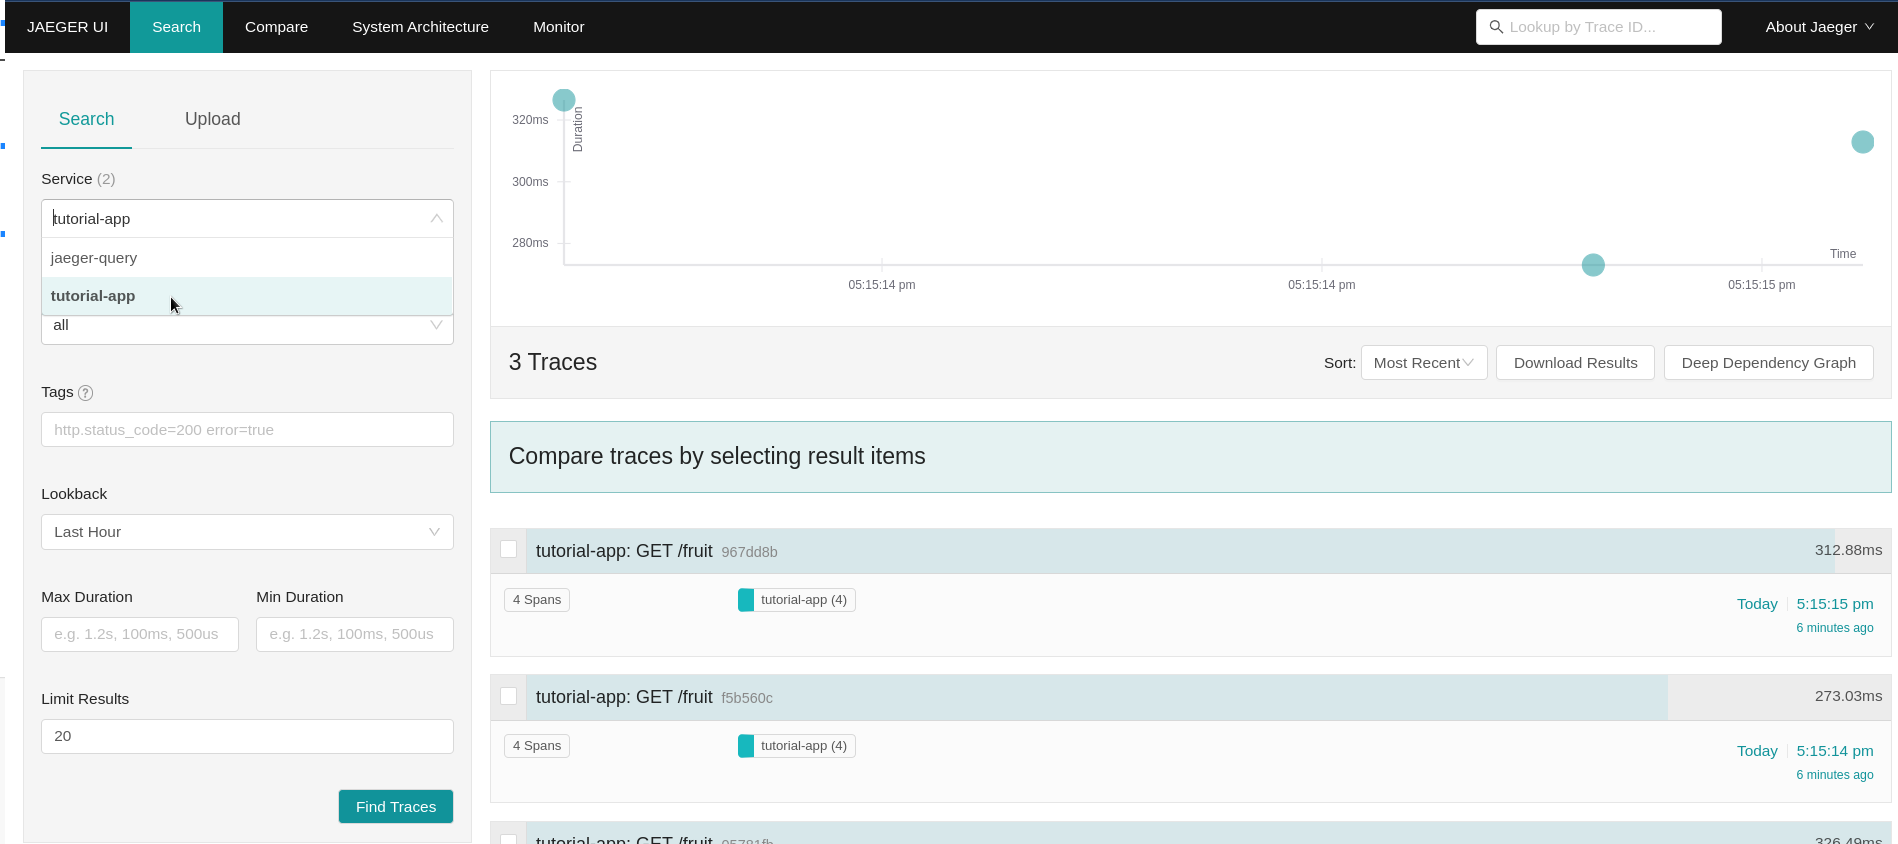
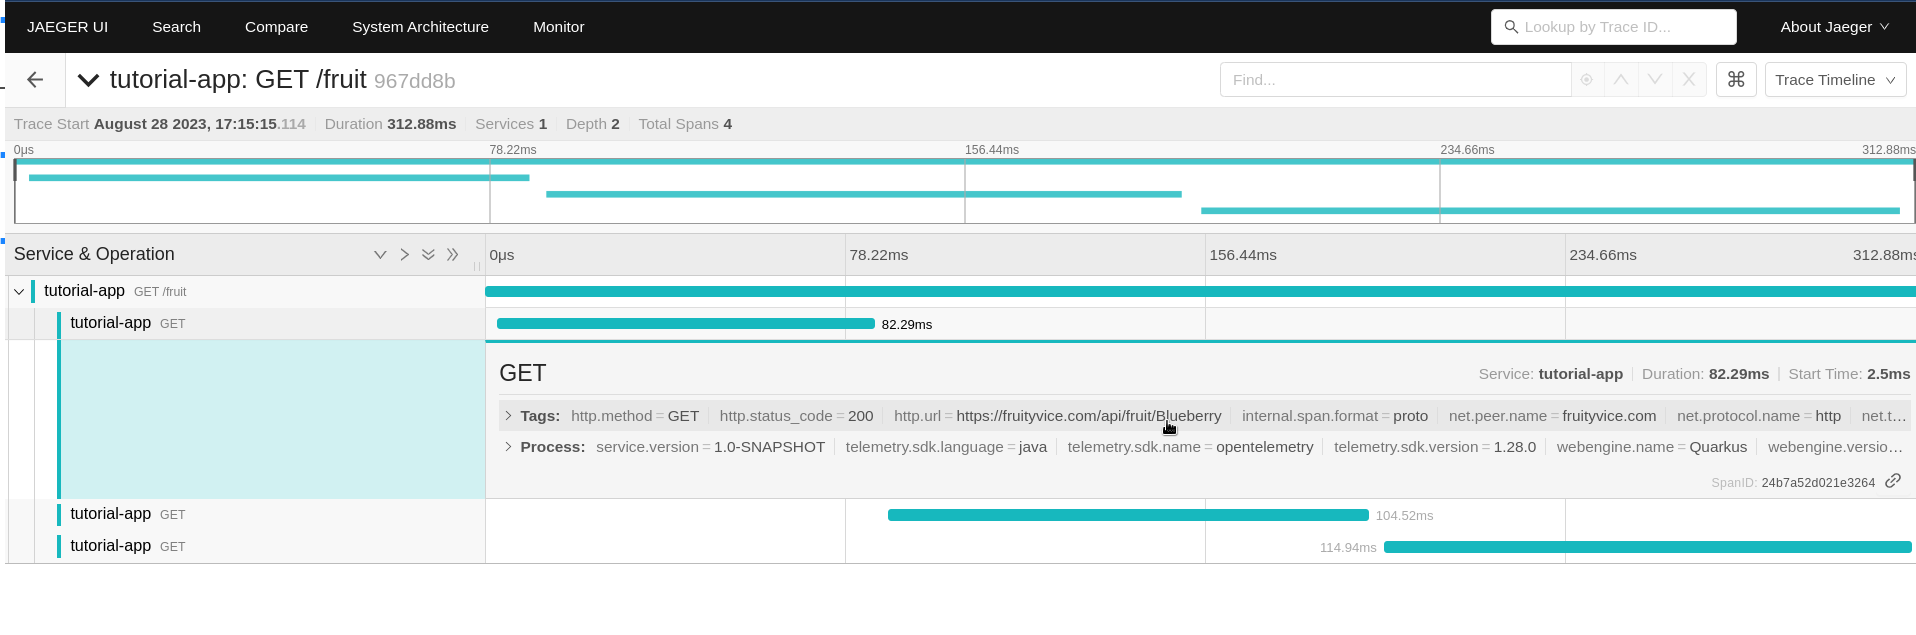
Click on the first "tutorial-app: GET /fruit" trace to drill into the details of the latest request. Notice that without doing any further work, even data from the calls out to the FruityVice REST service was collected, so we can see how long each request took:
Tracing Database calls
The keen observer (no pun intended) might have noticed that there is no tracing data for the database calls. To be able to do so, we’ll need to add the opentelemetry-jdbc dependency to our application. This time we’ll need to add the dependency directly to the .pom.xml file because it’s not a quarkus extension. Add the following snippet to your pom.xml just before the </dependencies> line:
    <dependency>
        <groupId>io.opentelemetry.instrumentation</groupId>
        <artifactId>opentelemetry-jdbc</artifactId>
    </dependency>
We’ll also need to add a new property to our application.properties file to enable telemetry for our datasource:
# enable tracing
quarkus.datasource.jdbc.telemetry=true
Create a few more requests to the fruit resource:
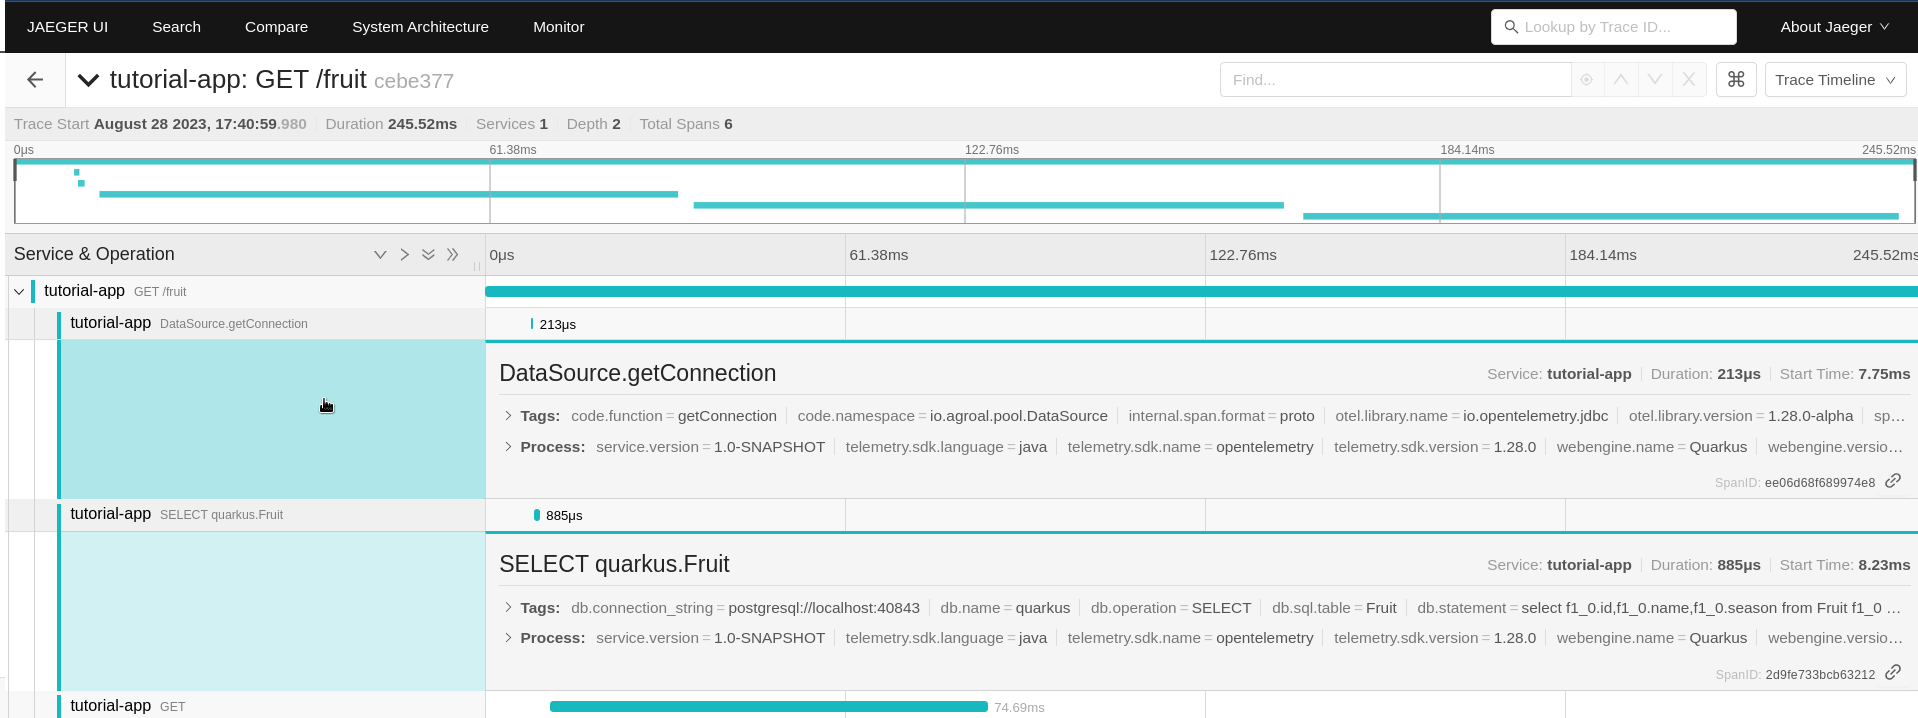
curl localhost:8080/fruit?season=Summer…And go back to the Jaeger UI at http://localhost:16686. Click the 'Find Traces' again (make sure the tutorial-app Service is selected) and click on the first trace from the top. You will now see 2 more spans, one with 'DataSource.getConnection' that shows how long it took for the DB connection to get established, and one with 'SELECT quarkus.Fruit' that shows the details of the DB query and how long it took.
Metrics
Observability also means the ability to expose, collect and observe detailed metrics about your application and the JVM running underneath (if applicable). Let’s add the metrics extension that enables this capability in Quarkus:
Add the Metrics extension
In a terminal window at the root of your tutorial-app project, run:
./mvnw quarkus:add-extension -D"extensions=quarkus-micrometer"quarkus extension add quarkus-micrometerYou should also add the quarkus-micrometer-registry-prometheus extension which formats the metrics in format that Prometheus can easily ingest:
./mvnw quarkus:add-extension -D"extensions=quarkus-micrometer-registry-prometheus"quarkus extension add quarkus-micrometer-registry-prometheusBy just adding these extensions, your application is now exposing metrics at the http://localhost:8080/q/metrics endpoint. You can also access the metrics by going to the Dev UI where you will see a new card "Micrometer metrics" and a link in that card to a Prometheus metrics page.
Create TimeResource
We can also generate custom metrics. Let’s add a custom counter that counts how many times a particular method has been called.
Create a new TimeResource Java class in src/main/java in the com.redhat.developers package with the following contents:
package com.redhat.developers;
import java.time.Instant;
import java.util.Calendar;
import java.util.TimeZone;

import jakarta.ws.rs.GET;
import jakarta.ws.rs.Path;
import jakarta.ws.rs.Produces;
import jakarta.ws.rs.core.MediaType;

import io.micrometer.core.annotation.Counted;
import io.micrometer.core.instrument.MeterRegistry;

@Path("/time")
public class TimeResource {

    private final MeterRegistry registry; (1)

    TimeResource(MeterRegistry registry) {
        this.registry = registry;
        registry.gauge("offsetFromUTC", this,
        TimeResource::offsetFromUTC);(2)
    }

    @Counted(value = "time.now") (3)
    @GET
    @Produces(MediaType.TEXT_PLAIN)
    public Instant now() {
        return Instant.now();
    }

    int offsetFromUTC() {
        return TimeZone.getDefault().getOffset(Calendar.ZONE_OFFSET)/(3600*1000);
    }
}| 1 | Meters in Micrometer are created from and contained in a MeterRegistry. |
| 2 | Add a gauge that returns a value computed by our application. |
| 3 | The @Counted annotation allows the Metrics extension to count the number of invocations to this method. |
Invoke the endpoint multiple times
We need to send some requests to our endpoint to increment our @Counted metrics, so use the following command:
for i in {1..5}; do curl -w '\n' localhost:8080/time; done2020-05-12T22:38:10.546500Z
2020-05-12T22:38:10.869378Z
2020-05-12T22:38:11.188782Z
2020-05-12T22:38:11.510367Z
2020-05-12T22:38:11.832583ZCheck the metrics
By default the metrics are exposed in Prometheus format. You can check the output by pointing your browser to http://localhost:8080/q/metrics. See if you can find the TimeResource counter result.

| In this tutorial we consulted the results in raw format, however these metrics are meant to be consumed by a monitoring system such as Prometheus so you can produce meaningful dashboards or alerts instead of accessing the metrics endpoint directly. |